![]()
|
|
|
Home
|
I wanted the data in a graphical and numerical form that I could look at and make some sense out of. This led us to invent our own compression tester that would allow us to do just that. The following are some of the results that we have obtained. We also wanted it to be portable. We wanted a device that you take to the car and acquire the data then bring it back to your pc and look at it. We did not want to have to bring the pc to the car or the car to the pc. For those of you that are thinking that "Hey I can make one of those and make some $$$ with it" the patents are pending. Putting this together has taken almost all of my spare time and that of my partners. For the last 6 years year we have had to gather information, design, fabricate, and assemble the components in order to make this thing work. Run tests and then re-test and verify if the data was correct. The equipment that we use is of the highest quality. There are export restrictions by the US government on some of the components. As you can see this is not kid stuff. The tests we are running are very accurate. It will allow the Shadtree mechanic as well as those at the highest levels of there professions to have data that is very accurate, yet simple to read and interpret. If you are interested in licensing this technology please contact us at sales@emotorsports.org and my partners and I will gladly discuss this with you. Enough of the legal stuff, please read on. You will find descriptions under the
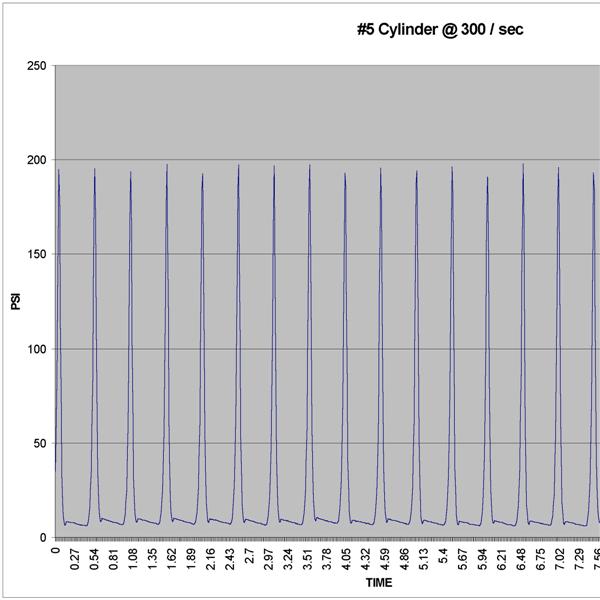
various graphs and you can click the various graphs to obtain a larger image. These are graphs that show before and after tests on a Toyota MR2 that I diagnosed and then rebuilt and then re tested after the rebuild
Before Rebuild Of Motor After Rebuild Of Motor
Before Rebuild Of Motor After Rebuild Of Motor
Before Rebuild Of Motor After Rebuild Of Motor
Before Rebuild Of Motor After Rebuild Of Motor The above
results clearly show that the # 2,3 & 4 cylinders were in poor ROTARY RESULTS 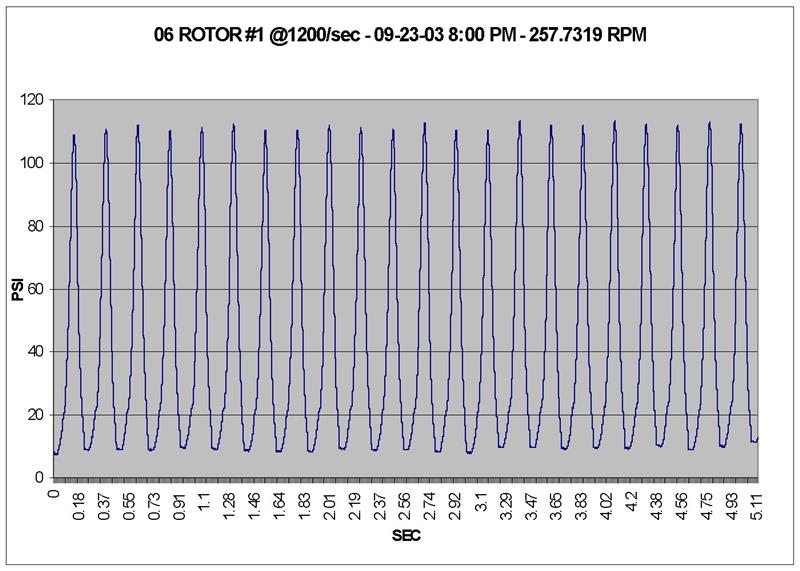 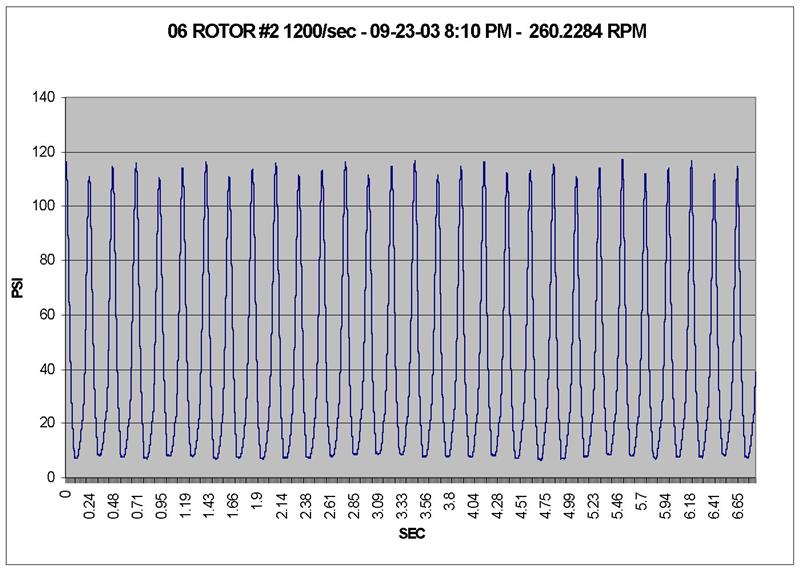 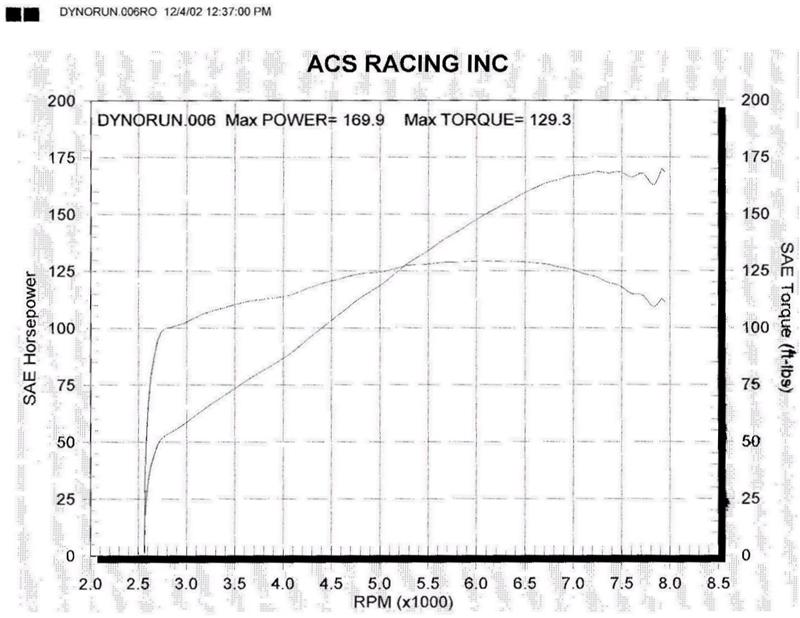
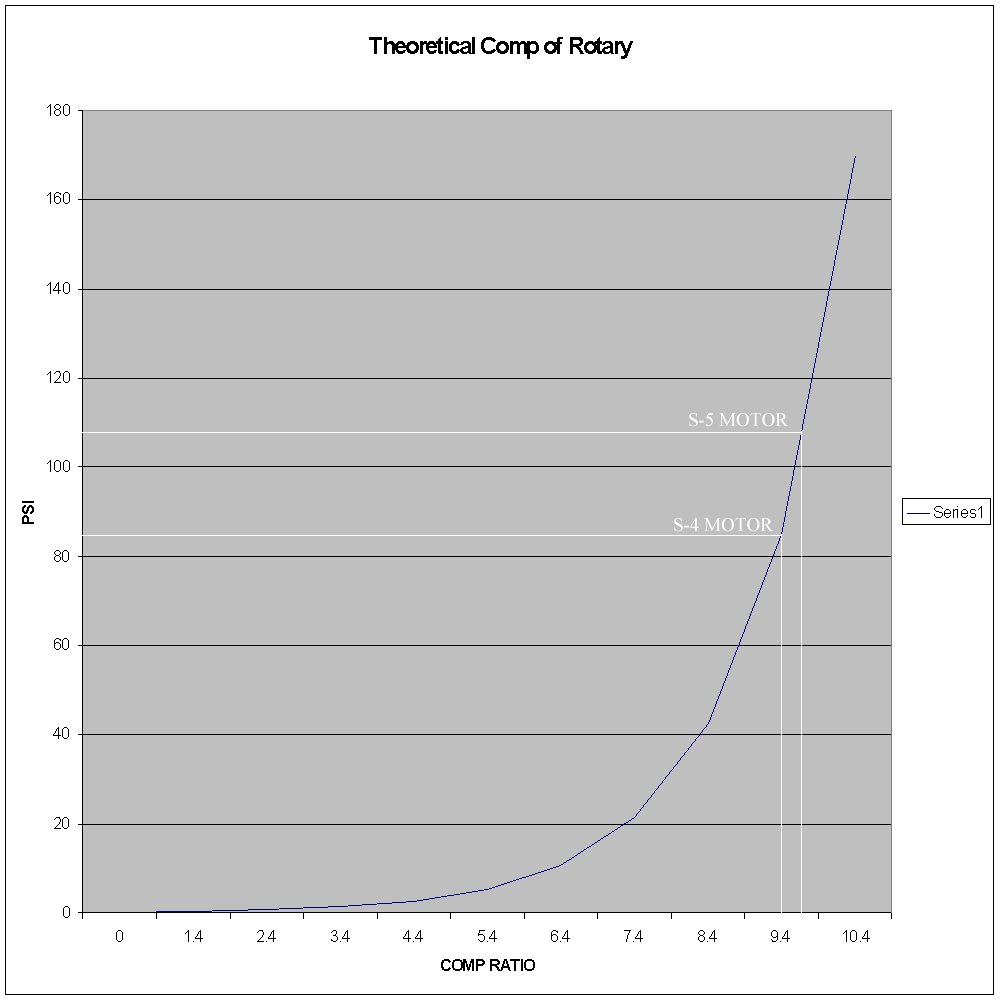
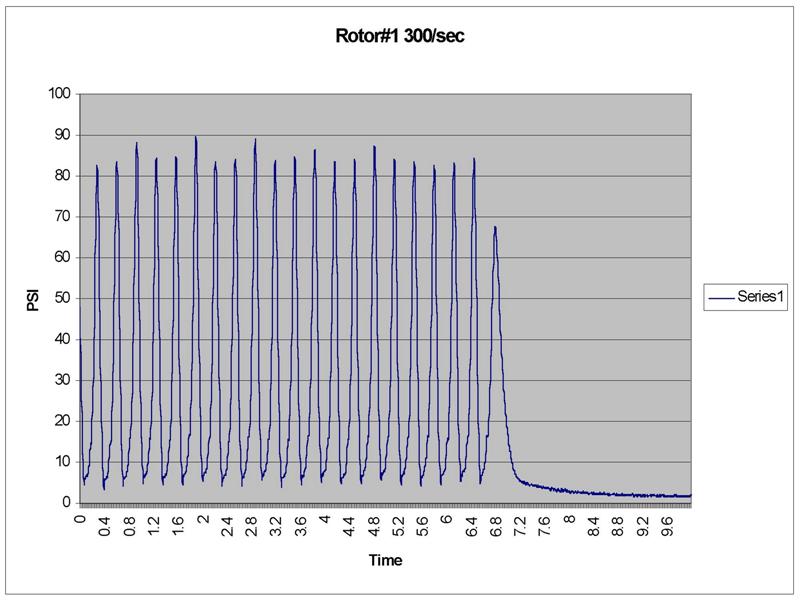
Click Graph For MUCH BIGGER Image. The two graphs above are from a rotary motor that was constructed using S-4 housings and S-5 rotors. Next to it is the Dyno sheet for the motor. You will notice that the readings are in the 110 PSI range on all faces of the rotors on both rotors. This seemed a bit high as the factory manual states that an S-5 motor should have a reading of around 85 PSI. It is noted in the shop manual that the S-4 motor should have a compression ratio of 9.4 to one versus the S-5 motor that has a comp ratio of 9.7 to one. But both list 85 PSI as spec for a compression test. It became obvious to us that if the compression ratio is higher in an S-5 then the PSI readings should be higher. If you scroll down you will see that we have graphed the Compression in PSI versus the Compression ratio based upon the S-4 motor spec's that are given in the Mazda Factory Manual. It verifies that if you have an S-5 motor with a compression ratio of 9.7 to one you should be getting PSI readings around 110 PSI Click Graph For MUCH BIGGER Image.
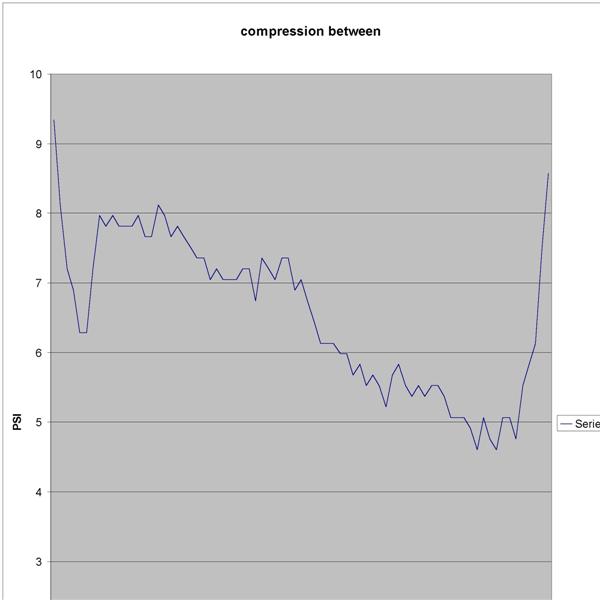
Click Graph For MUCH BIGGER Image. This is a graph generated from theoretical data.
We based it upon the S-4 factory manual spec with a compression rate of 9.4 /1 generating
85 PSI. Based upon this an S-5 motor will generate approximately 110 PSI based upon a comp
ration of 9.7 / 1. This was graph was generated in order to explain compression results
that were obtained from a S-4 motor that has S-5 rotors. This graph exactly replicated the
S-5 motor's 9.7/1 comp ratio PSI rating of approximately 110 PSI. It should also be noted
that this indicates that there is a printing error in the S-5 shop manual as to the
compression PSI readings that should be obtained from S-5 motors.
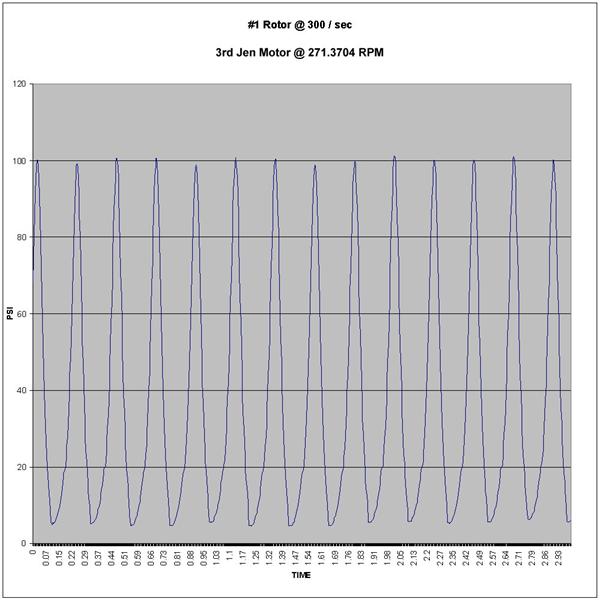
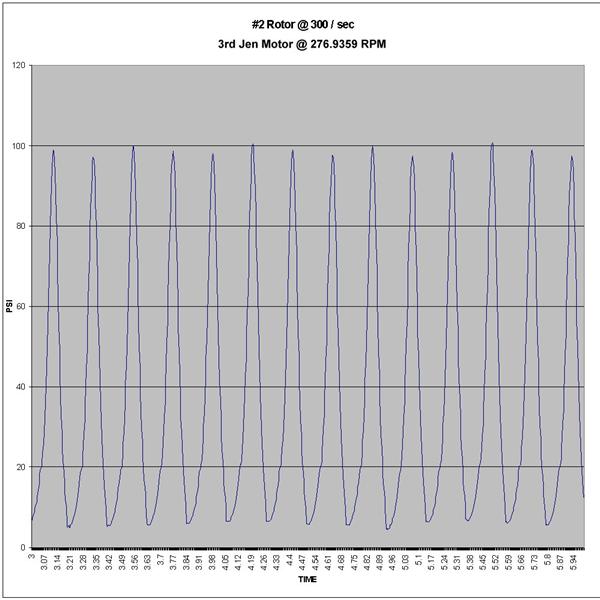
Click Graph For MUCH BIGGER Image.
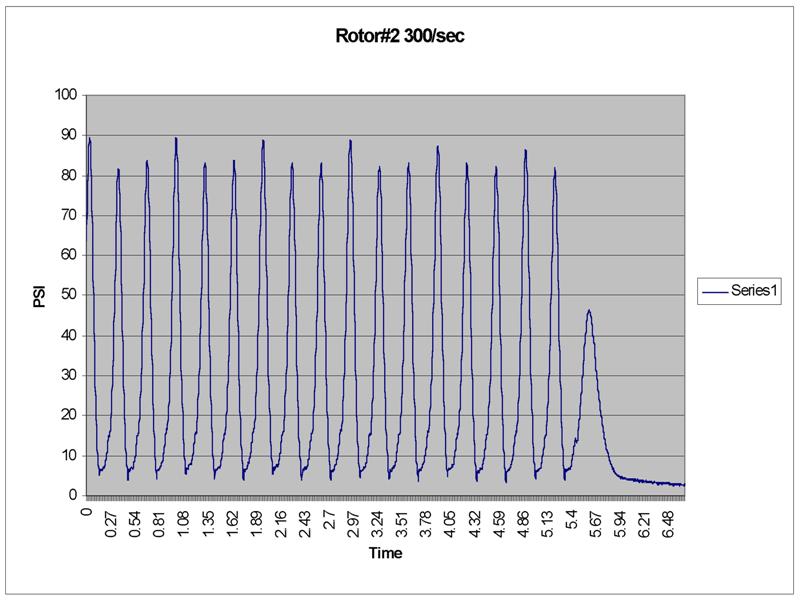
These two graphs are the test results from a
third generation RX7. Note that all the rotor faces are very close in PSI. Also note
that our equipment is able to detect a difference in two of the rotor faces indicating
that one apex seal is not sealing quite as well as the others. This is not out of
spec, it is just an example of the sensitivity of the equipment.
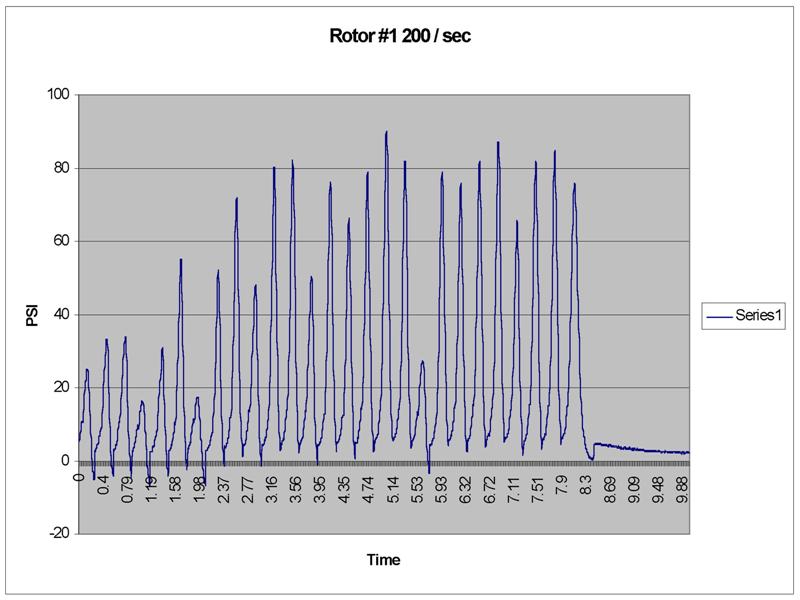
Click Graph For MUCH BIGGER Image. This is the test of an S-4 motor that had carbon sticking the
seals. As you can see it was in real trouble.
Click Graph For MUCH BIGGER Image. This is the same S-4 rotor after it was soaked with ATF and the carbon was dissolved. As you can see it is approaching compression numbers of a "normal" S-4 motor.
Click Graph For MUCH BIGGER Image. This is the motor's #2 rotor after it went through the same ATF treatment. It is now within acceptable specifications for the S-4 motor. Click Graph For MUCH BIGGER Image.
Click Graph For MUCH BIGGER Image.
I have a lot more information on piston engines that I have not posted. I will be putting it up as time allows. It is rapidly becoming evident that not only is this a way of seeing the compression cycle of a motor but also it will generate a profile of a motor. This means I can tell if your motor has been modified (IE if you are cheating in a particular class of race cars that does not allow for modifications to the motor)
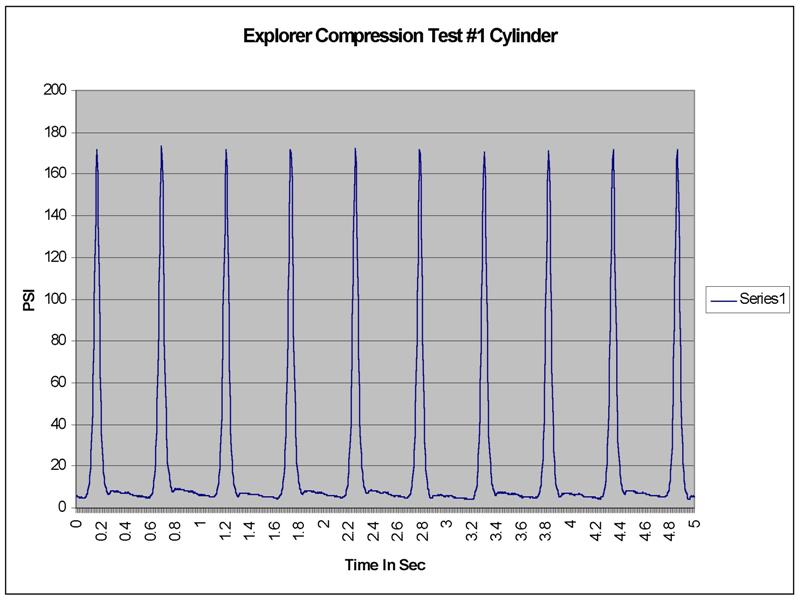
Click Graph For MUCH BIGGER Image. This is the test result from my 94 Explorer
Click Graph For MUCH BIGGER Image.
Click Graph For MUCH BIGGER Image. This is the test result from my 91 Explorer Click Graph For MUCH BIGGER Image.
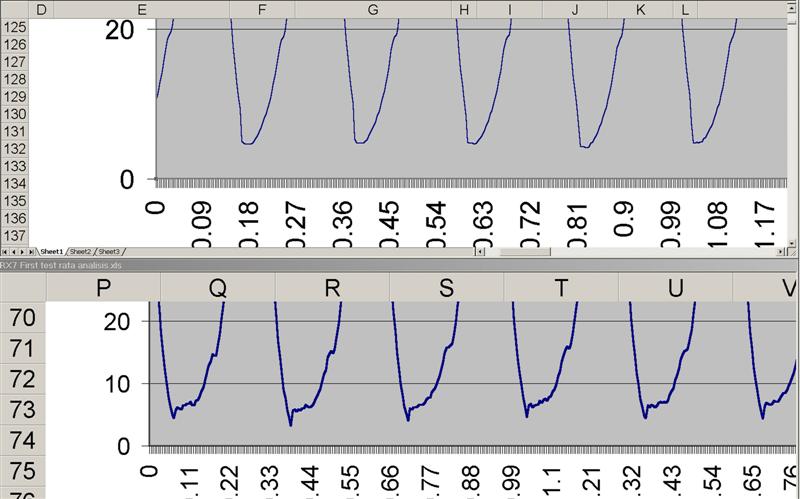
Click Graph For MUCH BIGGER Image. This is a graph of the exhaust and intake portions of the Test on my 1994 Explorer. Due to the 200 sample / sec range that I took, this is a bit choppy but with samples rates above 1,000 per second available this can be made much smoother.
|
|
>>Payment<< - >>Shipping<< - >>Warranty<<
Questions or problems with the site should be
directed to
web@emotorsports.org. |
![[Product Image]](images/prodimg.gif)